
概述
先贴上比赛地址:https://www.kaggle.com/c/ashrae-energy-prediction/overview
比赛大意是对不同地区建筑的能耗进行预测,即预测四种类型表的读数,是个典型的回归问题。相对之前的NFL来说,思路可以说是简单粗暴多了。
Data
先附上原始数据的数据词典, 数据源:https://www.kaggle.com/c/ashrae-energy-prediction/data
train.csv
building_id- Foreign key for the building metadata.meter- The meter id code. Read as{0: electricity, 1: chilledwater, 2: steam, 3: hotwater}. Not every building has all meter types.timestamp- When the measurement was takenmeter_reading- The target variable. Energy consumption in kWh (or equivalent). Note that this is real data with measurement error, which we expect will impose a baseline level of modeling error. UPDATE: as discussed here, the site 0 electric meter readings are in kBTU.
building_meta.csv
site_id- Foreign key for the weather files.building_id- Foreign key fortraining.csvprimary_use- Indicator of the primary category of activities for the building based on EnergyStar property type definitionssquare_feet- Gross floor area of the buildingyear_built- Year building was openedfloor_count- Number of floors of the building
weather_[train/test].csv
Weather data from a meteorological station as close as possible to the site.
site_idair_temperature- Degrees Celsiuscloud_coverage- Portion of the sky covered in clouds, in oktasdew_temperature- Degrees Celsiusprecip_depth_1_hr- Millimeters,降雨量sea_level_pressure- Millibar/hectopascals,气压wind_direction- Compass direction (0-360)wind_speed- Meters per second
test.csv
The submission files use row numbers for ID codes in order to save space on the file uploads. test.csv has no feature data; it exists so you can get your predictions into the correct order.
row_id- Row id for your submission filebuilding_id- Building id codemeter- The meter id codetimestamp- Timestamps for the test data period
所给的特征数较少,只有10+个,主要是建筑的meta特征与所处环境的特征,含义非常直白。
难点
整个做下来感觉这个场景比NFL要简单一些,难点主要有几个:
- 存在leakage的数据,合理利用leakage能对得分起到非常大的影响。我们主要用leak做了两个提升:1.通过leakage对最终结果做leak validation ,在模型融合时作为拟合结果的指标;2.提升lb的得分
- 最后需要对4种类型的电表进行预测,在建模时如何建比较好?最后是多种建模方案的融合,即每一种表建立模型 + 所有表用一个模型
- 特征构造部分难度较大,环境与建筑能好的专业性太强,可挖掘的特征较少
- 在特征没那么多好发挥的情况下,这个题主要就看模型了,最后blending的融合方式很关键
- 最后看top的选手分享经验说本题的难点在于异常值的识别与清洗
特征
主要进行了四类特征的挖掘:
建筑物相关的特征,如每层的面积,历史上的读数等等
性能提升较大的处理有target encoding,对每一个building id 进行编码,
kaggle编码categorical feature总结 https://zhuanlan.zhihu.com/p/40231966
kaggle中有关于target encoding的实现:https://www.kaggle.com/ogrellier/python-target-encoding-for-categorical-features(看代码理解原理,用的话建议直接用sklearn中的)
sklearn扩展库中有完整的实现:http://contrib.scikit-learn.org/categorical-encoding/targetencoder.html
将buildingid与其他的变量进行联合的agg,groupBy+ agg
对环境特征进行统计,如最近一个月的平均气温、平均湿度,即结合时间特征进行agg
- 专业性强的一些特征参考了discuss的实现
- 气温部分存在较多缺失值,用了线性插值进行填补( linear interpolation )
关注日期类特征,节假日,工作日等,每个季度,季节
尝试按不同的地区/季节进行数据集的划分,groupkfold,分数有所提高
模型
几种建模的思路:
- 每个表建一个模型:4个lgbm
- 总共建立一个模型:1个lgbm
- 根据每个site建立模型:16个site
- 根据每个building建模:500+的building
联合建模:
- site + meter
- building + meter
看了Top选手的分享,才有联合建模的思路,确实没想到,因为联合建模的模型数量确实很大,都是两个数量相乘的关系。根据leak尝试多种模型的组合,确定每个模型的权重,最后融合了4个模型,分别是两种实现的lgbm(4个表和1个表),公开的half-half产生的模型,以及一个队友提供的集成后的模型。
What didn’t work
- 更多建立模型的方式,如根据每个地区site建立一个(算力限制)
- 更多样化的模型种类,如NN
Thinking
这次比赛的数据量较大,对整体的算力有相当的要求,本来用的百度云的AI平台,每训练一次要12+个小时,时间太久了,后来换到了腾讯云的平台,20个CPU跑快多了,单次训练时长缩短至2小时(这些平台不支持lgbm的GPU版本,还是蛮蛋疼的),由于算力的限制,很多想尝试的建立更多模型的方案被搁浅了没能尝试,还是挺可惜的。
这次比赛提分的重点在于最后队友间差异性较大的模型的融合,因此前期大家都在努力完成自己的单模型,提升单模型对最后的结果有比较大的影响。
Top方案复盘
在第1,第2名的方案中,都提到了异常值剔除是很重要的一点,确实我们当时没有画很大的功夫在异常值的剔除上。他们手动确认了下列情况:
- Long streaks of constant values
- Large positive/negative spikes
- Additional anomalies determined by visual inspection
此外他们的建模还根据了site进行建立、根据building进行建立,所以模型的数量非常大,下面是第一二名方案的大致流程:
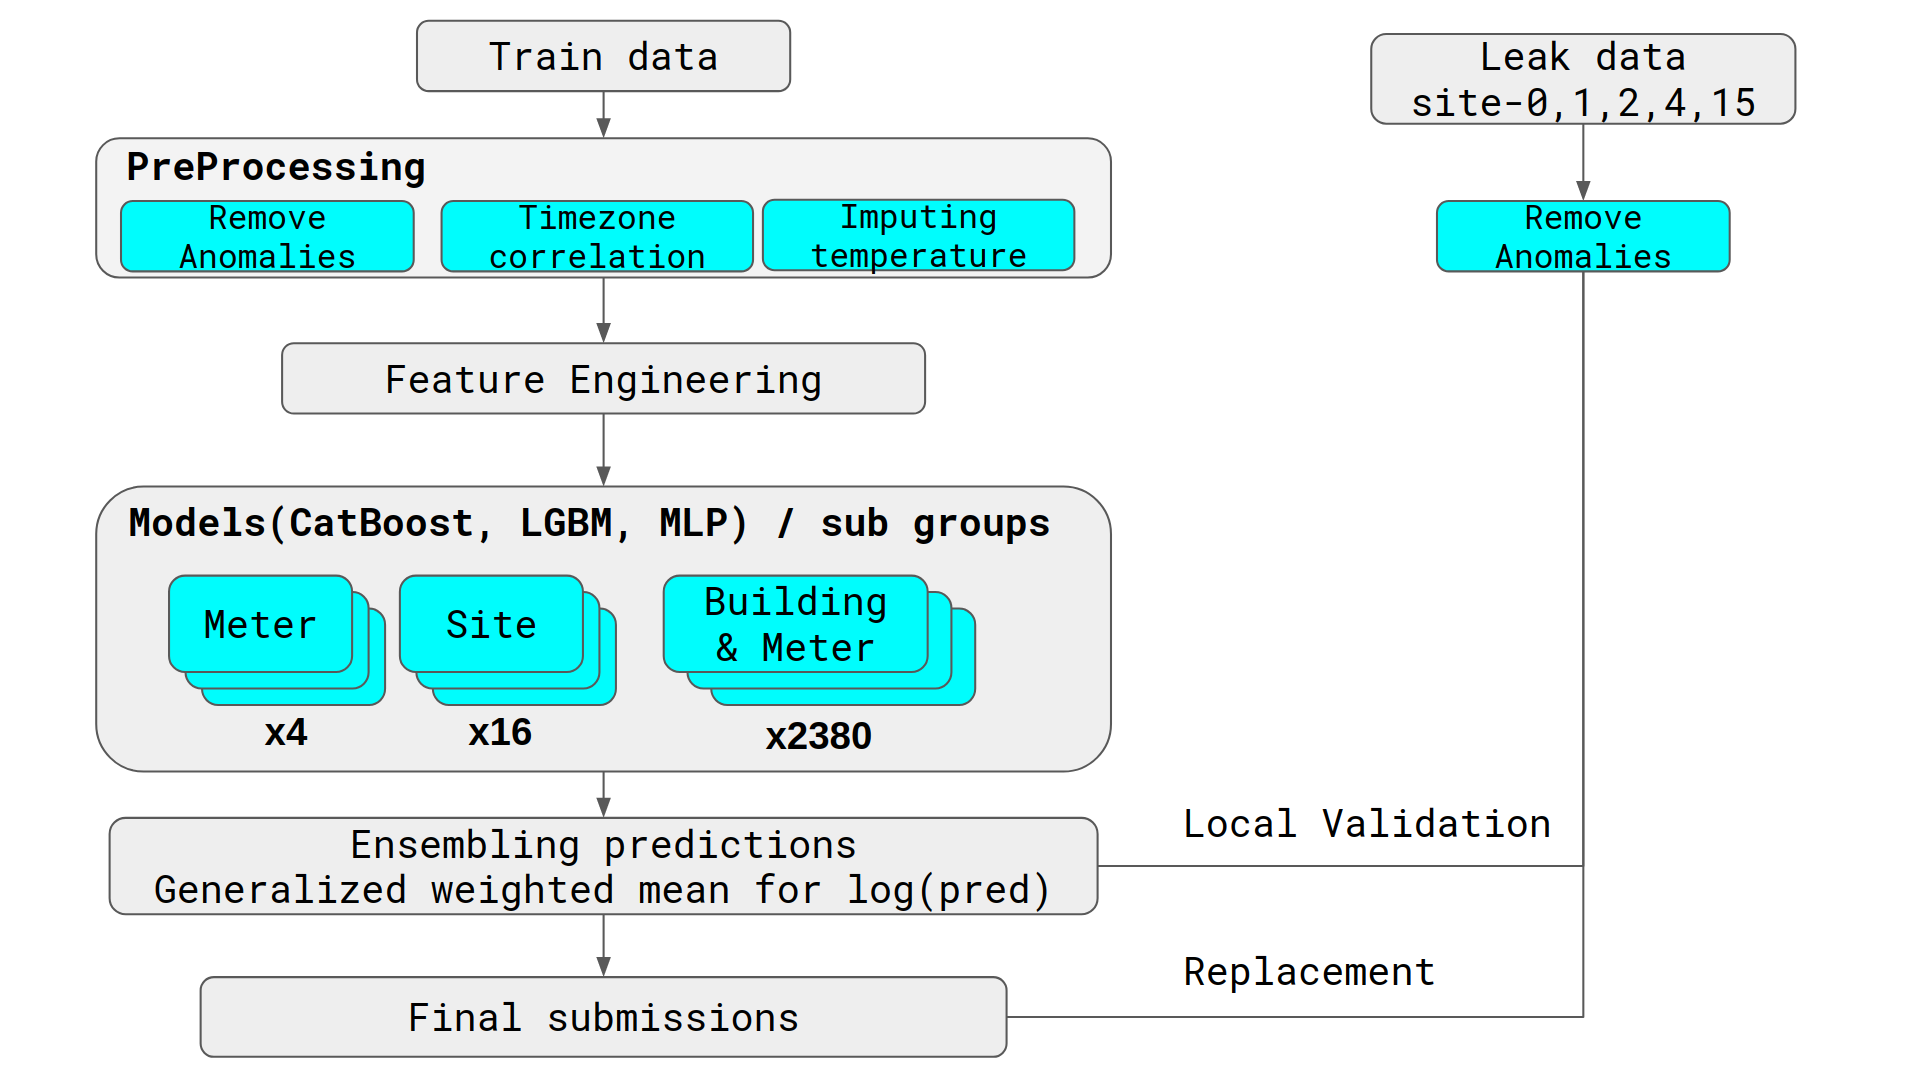
1 model per meter
1 model per site_id
1 model per (building_id, meter)
比较意外的是对每一个building + meter进行了建模,得到2380个模型。。。。额,好吧,这确实没敢想🤦♂️
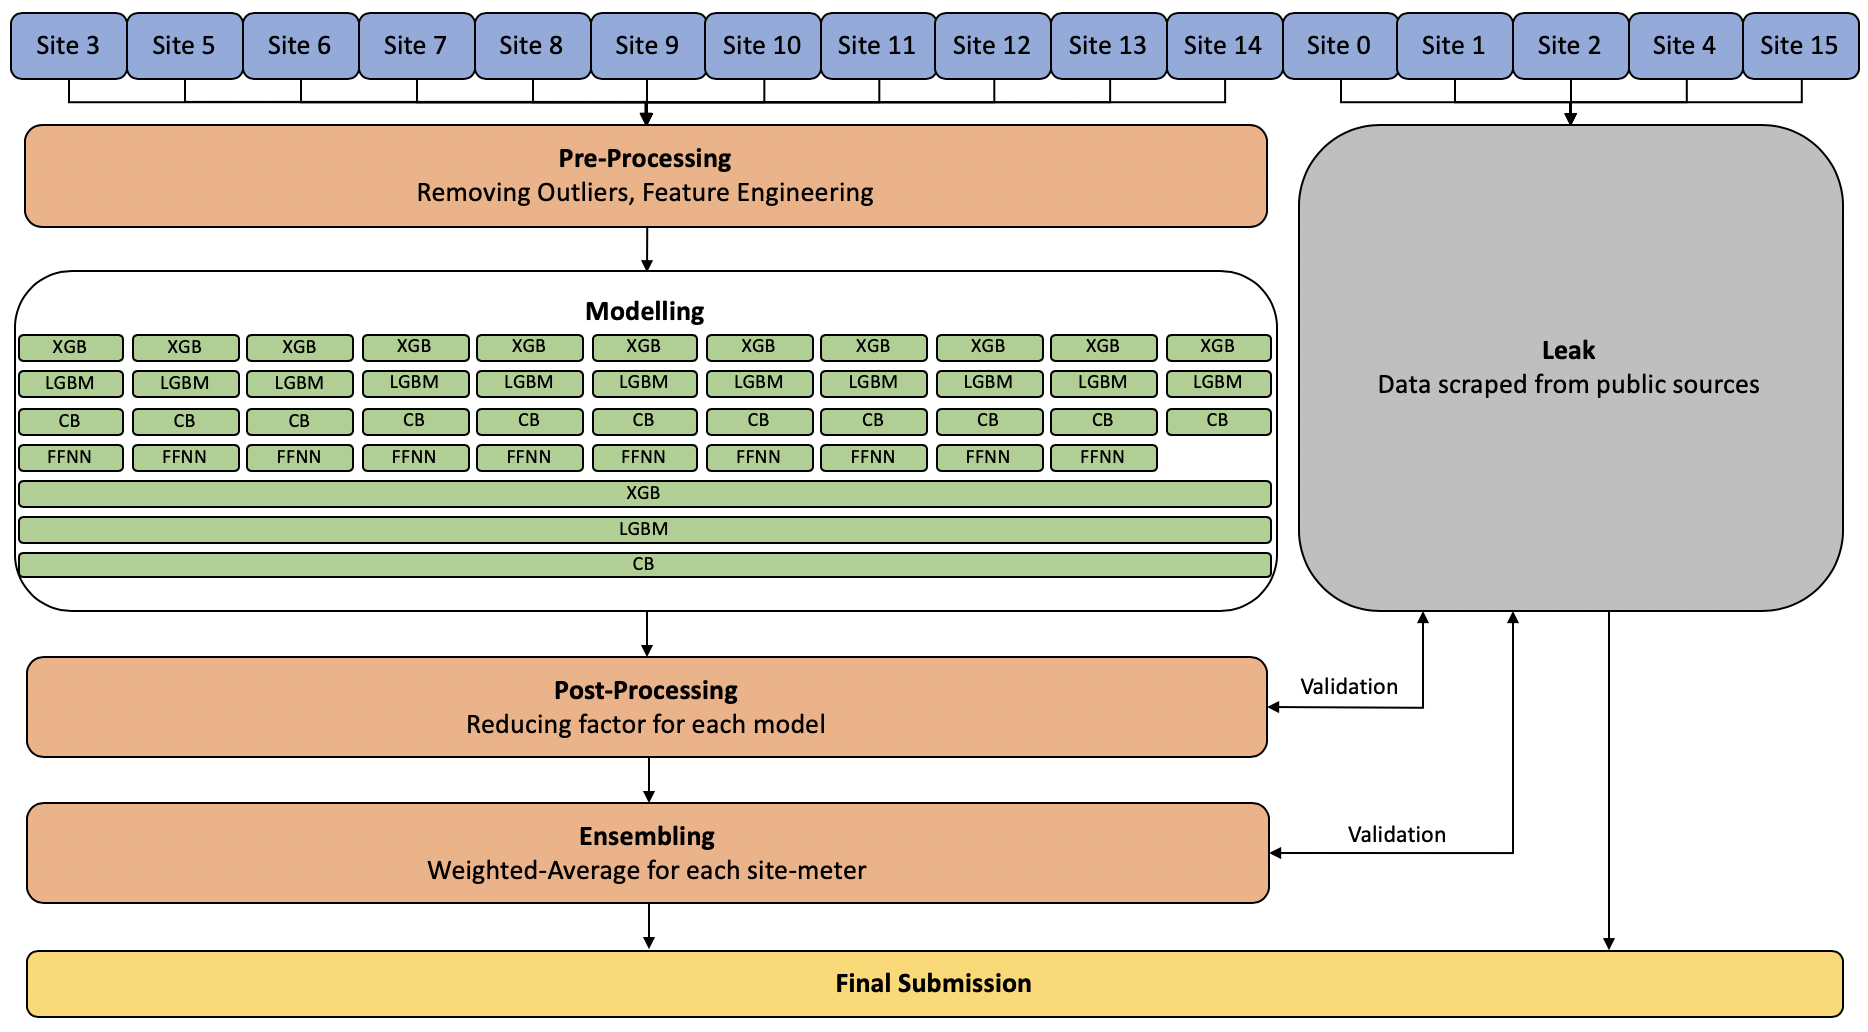
又看了第二名的方案(https://www.kaggle.com/c/ashrae-energy-prediction/discussion/123481),用到的模型数量也远在我们之上,他们的建模思路是site + meter,去掉leak 的话11个site *4 = 44个model